2023-07-17 00:00:00
7 min read
Welcome to our blog on Power BI tips and tricks! As data analysis and visualization become increasingly vital in the world of business intelligence, Power BI has emerged as a powerful tool for transforming raw data into actionable insights.
With its intuitive interface and powerful features, it has become the go-to-tool for data professionals worldwide.
Whether you're a seasoned Power BI developer or just starting your journey, this blog aims to equip you with a curated list of the top 10 tips and tricks to enhance your Power BI development skills.
Power BI Tip #1: Optimizing your Queries with the Query Editor.
In the realm of Power BI development, one of the most powerful tools at your disposal is the Query Editor. This feature allows you to transform and shape your data before it even reaches your visualizations.

When it comes to data transformation, the Query Editor provides a plethora of capabilities. You can perform tasks such as removing duplicates, splitting columns, merging tables, and filtering data based on specific criteria. By exploring these features, you can clean your data and ensure its accuracy and reliability. For example, you can remove unnecessary columns, convert data types, and handle missing values with ease.

For advanced data manipulation, the Query Editor provides access to the M language. M is a powerful functional language that allows you to write custom expressions and perform complex data transformations. With M, you can create custom functions, apply conditional logic, and merge data from different sources.

For detailed information regarding Query editor refer here.
Power BI Tip #2: Creating Effective Data Models
When it comes to building impactful and insightful reports in Power BI, a well-designed data model is the foundation. A robust data model not only ensures the accuracy and consistency of your data but also plays a crucial role in optimizing performance.
To create a solid data model, it's important to follow certain design principles.
- Identify the key entities and relationships within your data
- This involves understanding the data sources, their structures, and the business logic behind them.
- Establishing relationships between tables
- Relationships define how tables are connected, enabling you to combine data from multiple sources and create meaningful relationships between entities.

- When designing hierarchies, consider the natural relationships and dimensions in your data. For example, in a time-based dataset, you might create hierarchies for year, quarter, month, and day.
- Optimizing Data Model Performance.
- Techniques such as reducing the number of calculated columns, utilizing calculated tables instead, and implementing query folding can significantly improve query response times and overall report performance.
Power BI Tip #3: Mastering DAX Functions
Data Analysis Expressions (DAX) is a powerful formula language that allows you to perform calculations, aggregations, and filtering within Power BI.

DAX serves as the backbone for creating custom calculations and measures in Power BI. It offers a wide range of functions that cater to various analytical needs. Functions such as SUM, AVERAGE, COUNT, and MIN/MAX are commonly used for basic aggregations. Additionally, functions like CALCULATE, FILTER, and ALL provide advanced filtering capabilities to modify the context in which calculations are performed.
Functions like RELATED, CALCULATETABLE, and CROSSFILTER enable you to establish relationships between tables, manipulate filter contexts, and perform calculations across multiple tables.
Power BI Tip #4: Visualize your Power BI Dashboard.
A well-designed dashboard not only enhances the user experience but also improves data comprehension and engagement.
To create visually appealing dashboards, it's important to follow design principles that promote clarity and simplicity. Consider the information hierarchy, emphasizing the most important insights and organizing the content in a logical manner. Use whitespace effectively to give your visuals room to breathe and avoid clutter. Additionally, choose a consistent and visually pleasing color scheme that aligns with your organization's branding.

Utilizing the right colors, fonts, and layout can significantly enhance the user experience of your Power BI dashboards. Choose colors that are visually pleasing, while also ensuring they provide clear contrast for readability. Fonts should be legible and consistent throughout the dashboard.
Power BI Tip #5: Add Narrative Insights to your Power BI dashboard.
Each type of data requires specific databases and management systems to handle its unique characteristics. However, when it comes to data consumption, the approach takes an inverse direction. While transactional reports focus on a limited scope of data, analytical reports and dashboards present a diverse array of information, including key influences, KPIs, spatial data on maps, scorecards, trend lines, charts, graphs, and grids.
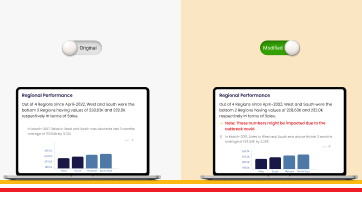
With such a wealth of data presented on dashboards, it becomes challenging for end-users to quickly grasp the key highlights by visually scanning the dashboard alone.
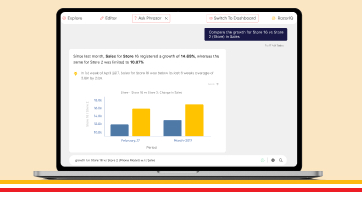
To improve this and the dashboard consumption it is important for users to describe their visuals with the help of Narrative Insights.
‘Phrazor Plugin’ a Power BI custom visual designed to enhance your data storytelling capabilities and generate narrative insights which can drill down into your data.
Setting up Phrazor Plugin is easy, simply:
- Select the report you want to run for generating visualizations and insights.
- Click Edit to activate the Visualization panel on the dashboard.
- Click on the three dots appearing at the end of the Visualization panel.
- Select ‘Get more visuals’ and search for ‘Phrazor’ to add it to your dashboard.
To learn more about Phrazor, refer to our blog where we compare it against Power BI’s Smart Narratives.
Power BI Tip #6: Leveraging Advanced Analytics Features
Power BI provides various advanced analytics capabilities, such as forecasting, clustering, sentiment analysis, and anomaly detection. These features allow you to uncover patterns, trends, and relationships within your data that may not be immediately apparent.
To enable and use the advanced analytics features in Power BI, you need to have the appropriate data and a clear understanding of your analytical objectives. Depending on the specific capability you want to leverage, you may need to ensure that your data is in the correct format, such as having a timestamp for forecasting or appropriate variables for clustering.
Real-world examples can illustrate the practical applications of advanced analytics in Power BI. For instance, you could use forecasting to predict future sales based on historical data, enabling you to make informed business decisions and plan accordingly. Clustering can help you identify customer segments with similar characteristics, allowing you to tailor marketing campaigns or personalize recommendations.
Power BI Tip #7: Performance Optimization Techniques
As your Power BI projects grow in complexity and scale, ensuring optimal performance becomes paramount.
The first step in performance optimization is identifying the areas that may be causing bottlenecks. This involves analyzing your data model, visuals, and data refresh processes. Use the Performance Analyzer tool in Power BI to identify which visuals or DAX calculations are consuming the most resources and contributing to slower performance. By pinpointing the specific areas causing bottlenecks, you can focus your efforts on optimizing those components.
To optimize query performance and reduce data refresh time, there are several techniques you can employ. First, ensure that your data sources are properly indexed and optimized for querying.
Utilize query folding, which pushes data transformation operations to the source database, minimizing the amount of data loaded into memory. Additionally, consider optimizing your DAX calculations by using techniques such as CALCULATE and SUMMARIZECOLUMNS to reduce the number of iterations and improve query efficiency.
We hope that this blog has provided you with authoritative insights and practical guidance to enhance your Power BI development journey. By applying these tips and tricks, you can become a proficient Power BI developer and deliver exceptional data-driven solutions to your organization.
So, go ahead and unleash the power of Power BI! Dive into the world of data analysis, visualization, and insights. Explore, experiment, and create remarkable reports and dashboards that transform raw data into actionable information.
Download the Phrazor Plugin to create Narrative Insights for your Dashboards and summarize them for your business Stakeholders.
About Phrazor
Phrazor empowers business users to effortlessly access their data and derive insights in language via no-code querying